The styling options provided for a layer are based on the type of data you are mapping. You will see different choices depending on whether your layer contains point, line, or polygon features. The options offered are also influenced by the type of data associated with your features. For example, a point feature might only have location information such as geographic coordinates but could also have categorical information such as tree species or numeric information such as air temperature. You can modify the symbology of your layers in the Compilation window, which gives you access to some of the styling capabilities available in ArcGIS Online or ArcGIS Enterprise.
Hinweis:
You can also replace map symbology with Adobe Illustrator libraries to use custom symbols, brushes, and swatches for layers in your downloaded artwork.
To access the styling tools, use the following steps:
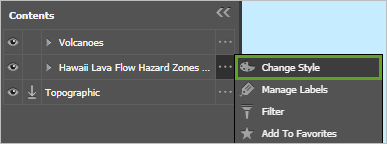
- In the Contents pane, point to the layer's options button and click Change Style.

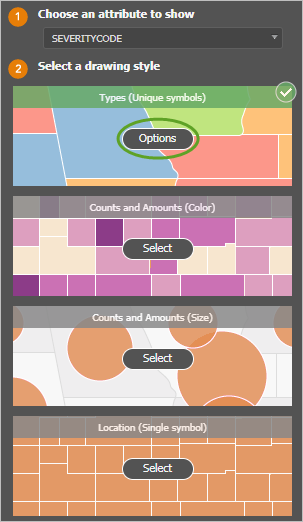
In the pane that opens, you see styling suggestions determined by the nature of the data. The options and default style selection change based on the type of attribute data you choose to show.
- Select a field from the list.
Hinweis:
If the layer has several fields, you can type a search term in the box to reduce the list of field names.
You'll see field aliases instead of the field names from the data if the layer has field aliases defined.
- Click Select for the style you want and click Options to change the default settings.

- Make changes to the symbol shape, fill color, and outline. If applicable, try different classification methods or modify the labels in the legend. After choosing from a variety of color ramps, you can adjust individual colors by clicking each symbol.
As you choose styles and modify symbols, you can preview how the layer will appear in your map.
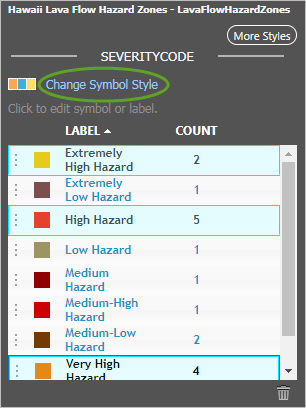
- When styling the layer based on categories, you can select multiple rows in the list to delete or update several symbols at once. Use Ctrl (Command for Mac users) to select only specific rows or Shift to select a continuous range.
- To delete the selected rows, click the Remove selected symbols button
 . The features with those values will no longer appear in the map.
 - To update the selected symbols, click Change Symbol Style or click one of the selected symbols to use its style for the selected set.
Tipp:
Click the Label and Count headings to sort the list by type or number of features with the same value.

- To delete the selected rows, click the Remove selected symbols button
- Optionally click More Styles to go back and select another style or
attribute to experiment and find the best way to display your
data.
To learn more about the styles and settings, see this style reference.
Hinweis:
The options will vary from those available in ArcGIS Online and ArcGIS Enterprise.
- Click OK to commit your changes or click Cancel. (You can also click Undo to revert the style after clicking OK.)
Styling considerations
There are some considerations when using smart mapping capabilities in the extension.
- You cannot create heat map symbols in the Compilation window, but you can consume heat maps from an existing web map.
- The extension only supports vector marker symbols for points. Picture marker symbols will be replaced with simple vector symbols. You can modify the symbol shape, fill color, and outline if you don't plan to use custom symbols from an Illustrator library.
- Symbol level transparency is disabled. Only layer level transparency is supported. If polygon layers had transparency applied at the symbology level, you can reapply transparency on the entire layer using the Transparency slider.
- Feature level transparency is disabled.